

Why use it
Machine health:- Confirm a machine is online, reporting, and healthy before or after a rental
- Catch hardware problems early, such as a GPU running hot or clocking down
- Investigate a client complaint about a slow, unresponsive, or underperforming machine
- See whether containers on the machine are running cleanly or crash looping
- Track down performance issues or unexpected drops in throughput
Opening the dashboard
Open Machine Metrics in the Host section of the console, then pick a machine from the Machine ID dropdown. You can also open a specific machine from Host → Machines with the View metrics option on the machine card.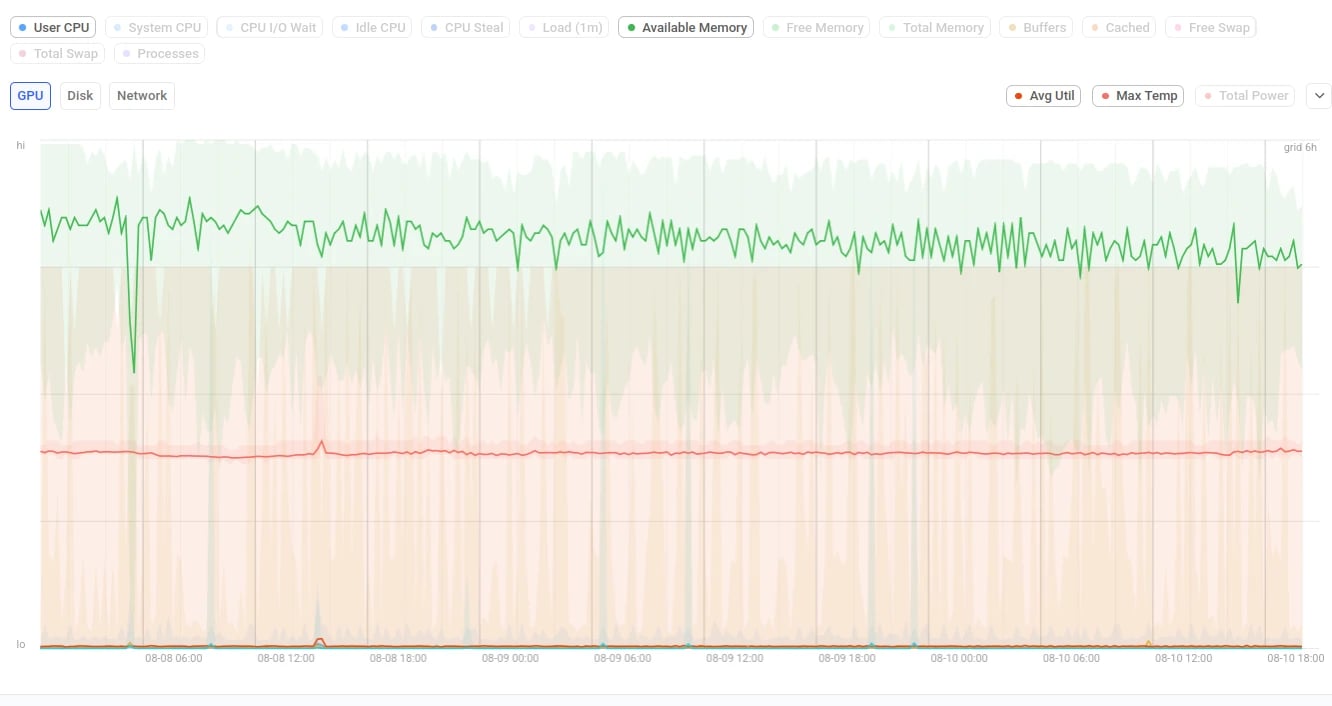
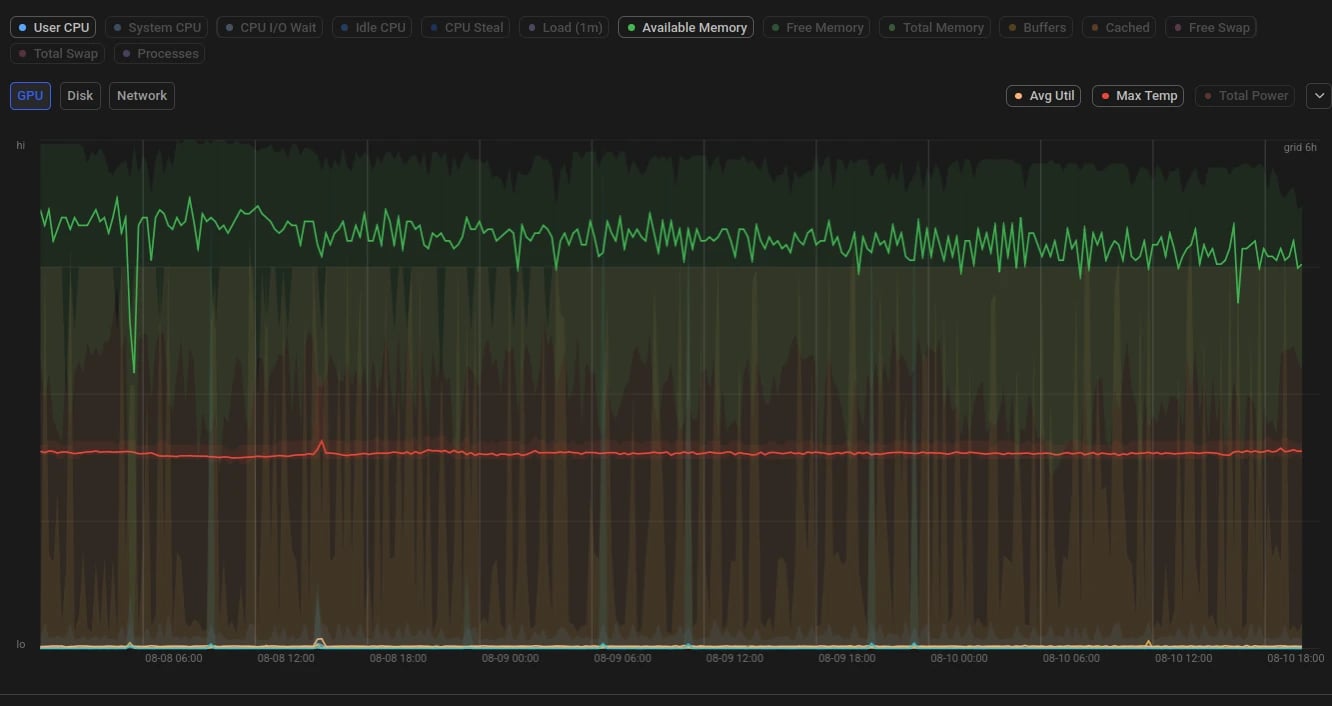
The metrics chart, with memory and GPU series selected
There is nothing to install or enable. The Vast daemon collects and uploads this data automatically, so a machine that is listed and up to date will appear on its own.
What gets collected
The Vast daemon collects the following data from your machines:
Samples are batched on the machine and uploaded periodically, at a rate that depends on how much data the machine is producing. If the machine goes offline, its data is saved locally and uploaded when it reconnects, so an outage appears as a gap that fills in later. A very long outage eventually loses its oldest data.
This is not a real-time tool. The page loads the window ending at the moment you opened it and does not advance while the tab stays open, and the most recent data can be hours behind. Reload the page to pull in whatever has arrived since.
Metrics chart
The chart covers the last 7 days by default. Every metric has a button above it: click to add that series, click again to remove it.CPU
Memory
GPU, disk, and network
Select the GPU, Disk, or Network tab to chart whole-machine summaries for that hardware:
Expand the tab with the arrow on its right to chart each device separately. This is how you spot one card in an eight-GPU box running hotter or slower than the rest.
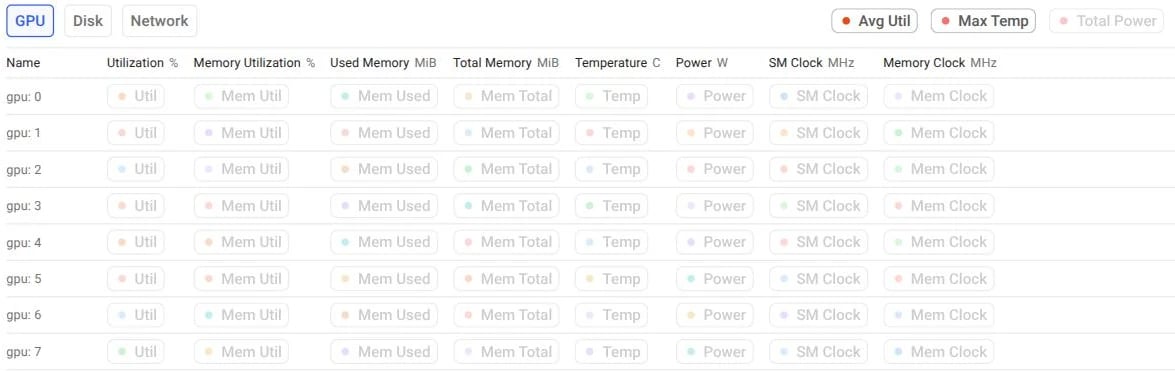
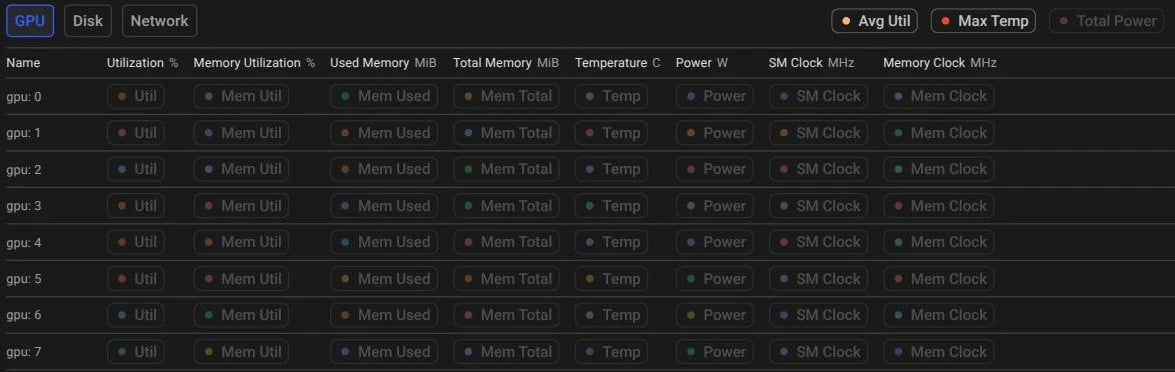
The GPU tab with its per-device grid expanded
Reading the chart
Each series is drawn between the hi and lo marks on its own scale, so metrics with different units share one chart. The solid line is the average and the shaded band is the min to max range, which is why a variable series looks like a band when zoomed out. Hover anywhere to read values at that moment. All timestamps on this page are UTC. To move around the timeline:- Drag to pan through time, or scroll to zoom in and out around the cursor
- Use the zoom in and zoom out buttons in the toolbar for fixed steps
- Reset returns to the default 7-day window and the default set of metrics
- All off clears the chart. All on turns on the CPU, memory, and summary metrics, but leaves per-device series off so the chart does not fill with one line per GPU
Containers
Below the chart, a timeline shows container activity for the time range you are viewing. One row per container appears on the machine during the window, so you can see the rental history at a glance: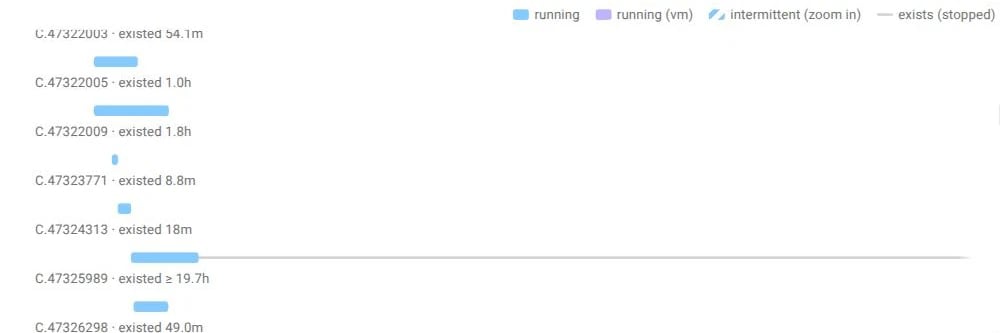
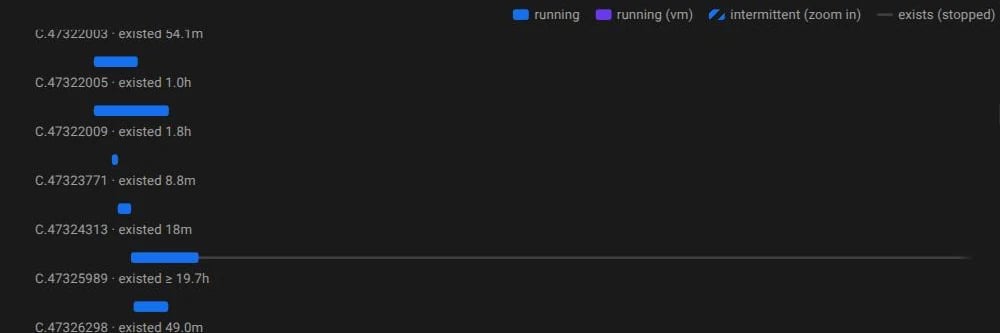
Separate rentals at different times. C.47325989 ran, then stopped while still present on the machine, so its bar gives way to a thin line
A striped bar is a zoom artifact, not a problem. Zoom in to see the real pattern: restarts every few seconds are a crash loop, while a few runs spread over days is normal rental activity.
Troubleshooting
Limitations
- VM machines report everything except GPU metrics for now. The page shows a notice when you are looking at one.
- History starts when the machine first reported in its current recording format. A recently set up machine has a shorter history than the default 7-day window, and a daemon update that changes the recording format restarts it.
- There is no set retention period. Nothing is deleted on a schedule today, so a machine’s history keeps growing for as long as it reports.